Pulmonary Nodule Analysis on CT scans
Yiting Xie and
Artit Jirapatnakul From the I-ELCAP website:
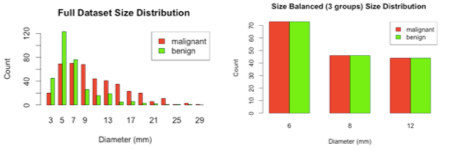
Lung caner often first manifests as opaque lesions in the lung, sometimes referred to as "pulmonary nodules". Recent advances in helical CT scanner technology have improved the resolution of the CT images, along with the speed at which the images are acquired. The increase in resolution in both the in-plane and out-of-plane resolutions introduces not only larger images, but a larger number of slices. This poses an additional burden on the radiologist because she/he must not only review larger and more detailed images; but she/he must also review a larger number of images than before. With such an information explosion, it becomes natural to use a computer as a tool to assist the radiologist in the detection, identification, analysis, cataloging, visualization and diagnosis of pulmonary nodules in CT scans. Automated analysis of pulmonary nodules can be divided into two main areas: measurement and characterization. The ultimate goal is to incorporate algorithms in both areas into radiological workstations for use by radiologists in clinical practice MeasurementOne of the most reliable indicators of the malignancy of pulmonary nodules is their growth rate, with higher growth rate typically more indicative of cancers. Accurate growth rate measurement requires accurate and robust nodule segmentation algorithms. A recent publication describes the semi-automated method developed by Reeves et al on nodule segmentation [1]. Briefly, when provided with the location of a nodule in a CT scan, the algorithm extracts a region around the nodule, segments the nodule from attached structures, and produces colored two-dimensional and 3D images of the segmented nodule. Volume is computed from the segmented image. Progress is being made to improve the reliability of the segmentation algorithm in the presence of other attached structures, such as blood vessels, airways, and the thoracic wall. One difficulty in the evaluation of any segmentation or measurement algorithm for pulmonary nodules is that it is impossible to determine the "true" nodule size. Recent work suggests that there is large deviation even amongst radiologists as to the size of a nodule [2]. One possible substitute is the use of mathematical models to estimate the nodule volume based on previous scans of the same nodule [3]. An exponential model is commonly used to describe the growth of malignant nodules; however, fitting such a model requires at least three comparable scans of the same nodule, which are often difficult to obtain. CharacterizationIn contrast to growth analysis, automated methods for nodule characterization use features available from one CT scan to determine the malignancy of the nodule. Some features that might be used include size, shape, or density. Characterization is a difficult task due to the lack of knowledge of what attributes are correlated with malignancy. Preliminary results on characterizing nodules using 3D shape, curvature, and density features were reported by Jirapatnakul et al [4]. There have been many other studies in this area, but for many of the studies for which size-distribution information was available, much of the reported performance could be derived from the size of the nodules alone [5, 6]. The preliminary work has been extended [7] to evaluate the impact of size distribution on characterization outcome by employing a large dataset of 736 nodules from lung cancer screening chest CT scans (I-ELCAP [8] and NLST [9]). Furthermore, a subset is constructed with 163 malignant nodules and 163 benign nodules with the same size distribution. Malignant status is determined through pathological diagnosis. Benign status is determined through pathological diagnosis or two years of no clinical change. Only solid nodules and solid components of part-solid nodules are selected for this study. Malignant and benign nodule size distributions are shown in Fig. 1 for the full dataset and the balanced subset GA, which consists of three individual bins G6, G8 and G12.
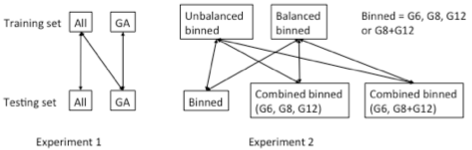
Figure 1. Size distribution of the full dataset (left) and the size-balanced subset (right). Machine learning classifiers were used to distinguish malignant and benign nodules using the image features. The Area Under the ROC curve (AUC) was used as the performance evaluation metric. Characterization was performed on the full size-unbalanced dataset, the size-balanced subset as well as the individual bins. The organization of the experiments is summarized in Fig. 2.
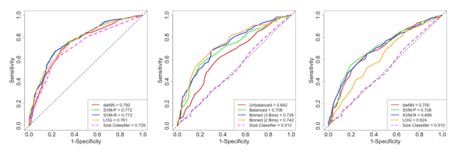
Figure 2. Organization of the experiments using the full dataset (All), the size-balanced subset (GA) and the individual bins (G6, G8, G12). Experiment results are shown in Fig. 3. It was shown that when both training and evaluation sets were size-unbalanced, the highest AUC only had a small increase compared to that using size alone (incremental AUC = 0.047). The incremental AUC was increased to 0.198 when trained and evaluated on GA. It was also shown that when evaluation set was size-balanced, the highest AUC was achieved by using a classifier trained from the binned data (highest AUC = 0.742).
Figure 3. Average ROC curves under different training/evaluation schemes. Left shows that using unbalanced training and evaluation; middle shows that using balanced training and evaluation; right shows the highest AUC under each training/evaluation scheme. In conclusion, the size distribution difference between malignant and benign nodules has a large impact on characterization outcome. Evaluation of a characterization method on a size-balanced dataset reflects the image representation difference between malignant and benign nodules conditioned on a certain size range. Performance of such systems can be greatly improved when training is performed using size-balanced and size-binned nodules.
|