
|
|
Table of Contents:
Details of the VOLCAMAN'10 Study:The focus of this study is change analysis from manually determined volumetric assessment of pulmonary nodules from CT images. A previous challenge study (VOLCANO) has used this same data set to evaluate change using computer algorithms. The focus of this study is not directly on the estimated volume of each lesion itself (which tells us little of the underlying disease) but rather the change in size of the lesion recorded on two time-separated images. This size change is a critical measurement for (a) diagnosing cancer and (b) evaluating response to therapy. One of the most important indicators of malignancy is the relative change in size of a nodule over time. The critical issue for this study, s to establish the precision of manually determined size change measurement for nodules of varying size as well as other features.
Motivation for the StudyCurrent approaches to quantification of nodule volume change measurement exhibit two main problems that complicate their direct comparison. First, large unified database of both stable and growing nodules are needed in order to perform these analysis. Second, there is no single commonly used evaluation technique that would assess the measurement quality of a particular method. This unique study can address both of these issues by providing a well-documented single evaluation image dataset and a common methodology for assessing the quality of the measurement algorithm. Further by analysis of results from a large number of participants with a broad range of experience we will develop a robust characterization of manual lesion marking behavior. This data will be made publicly available as a reference benchmark for both computer and manual marking methods. This novel study that is entirely web-based will allow for a large number of participants. Analysis of the results will provide an expert characterization of a reference set of images. These images, together with annotations from this study and the results from the VOLCANO study will be made publicly available as a benchmark to be used by all researchers to advance the state of the art in lesion measurement. Goals of the StudyTo gain a better understanding of variability in manually determined nodule volume measurements. We will also obtain a benchmark set of well documented lesion pairs that will be made publicly available to facilitate the quantitative evaluation of future lesion marking methods. RulesOrganization of this study and maintaining this website is a large effort. We ask everyone who decides to participate in the study to read and accept the following rules.
Data DescriptionThe image data used in the study was acquired for the Public Lung Database to to address drug response. Cases were selected that contained at least one nodule of solid consistency which was present in at least two scans with a whole-lung field of view including the entire nodule. Only nodules visible on at least three slices on both scans were included. For the VOLCAMAN study two nodules are used for training and 24 nodules are used in the evaluation dataset Evaluation DatasetThe VOLCAMAN study involves 24 nodules selected from the VOLCANO evaluation dataset. The VOLCANO evaluation dataset consists of 49 nodules divided into three categories. The first category consists of 27 nodules visible on two scans of 1.25 mm slice thickness, with little observed size change, and a range in diameter from approximately 4 - 24 mm. The second category of nodules included 13 nodules imaged on either two 2.5 mm scans or one 1.25 mm scan and one 2.5 or 5.0 mm scan to examine the effect of slice thickness on the size change measurements. The nodules ranged in size from approximately 8 – 30 mm. The third category consists of an additional 9 nodules on two 1.25 mm scans, but a large size change; these nodules ranged in size from approximately 5 – 14 mm. These cases represent a cross-section of the nodule sizes that are of most interest from the diagnostic viewpoint. All cases were externally reviewed and determined to be of good quality. The approximate size distribution of nodules in the evaluation dataset is shown in the plot below: 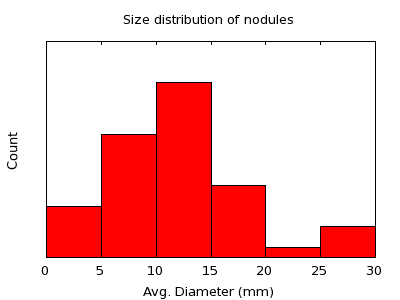 The sizes used to produce this histogram are only estimates. |
||||||||