vd.dispmvx, (vd.dispsvx)
vd.dispmvx(vximage, [vximage2],..., [grid=], [scale=], [size=], [capt=...], [pvalues=False], [file=...])vd.dispsvx(vximage, [vximage2],..., [scale=], [size=], [capt=...], [file=...])
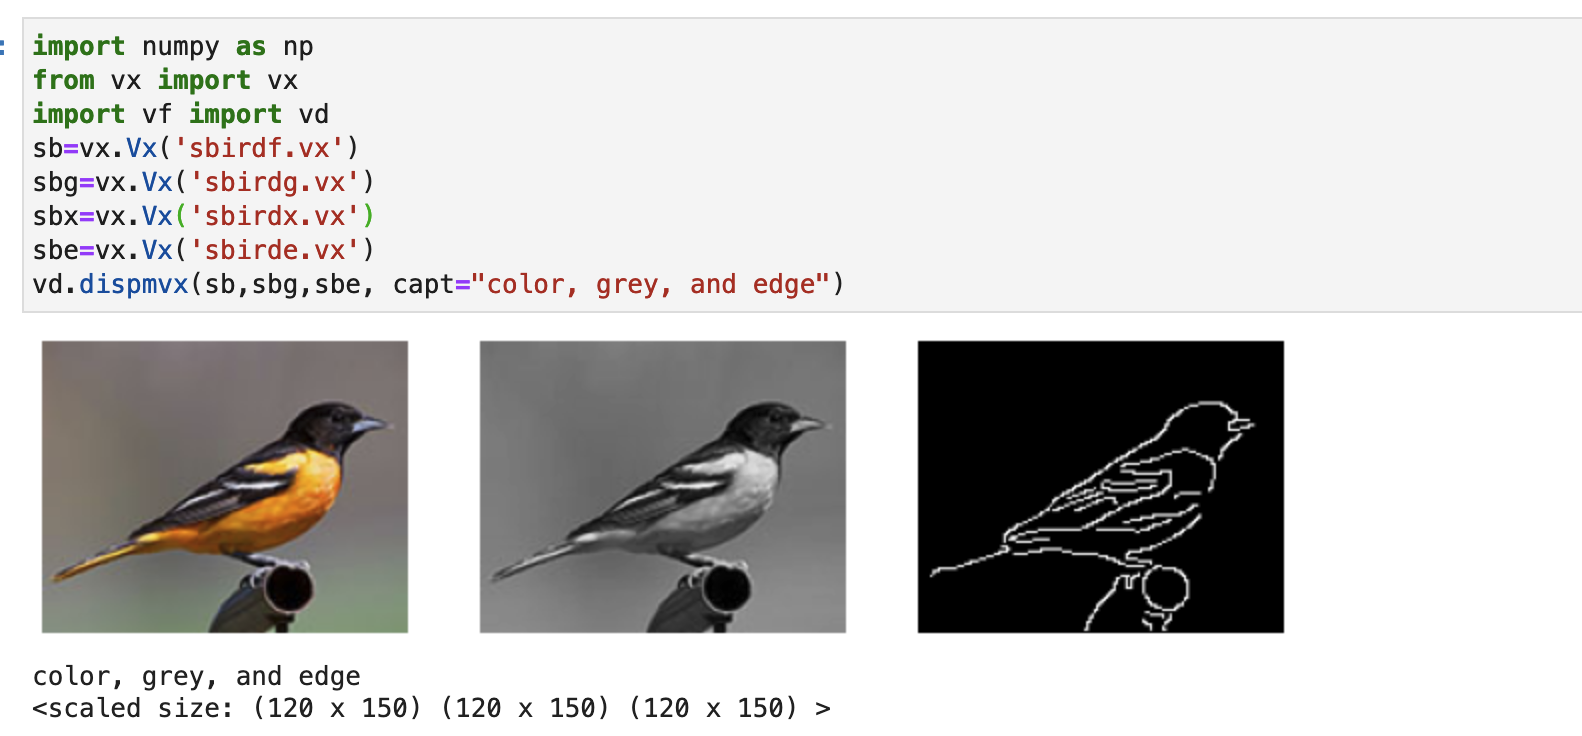
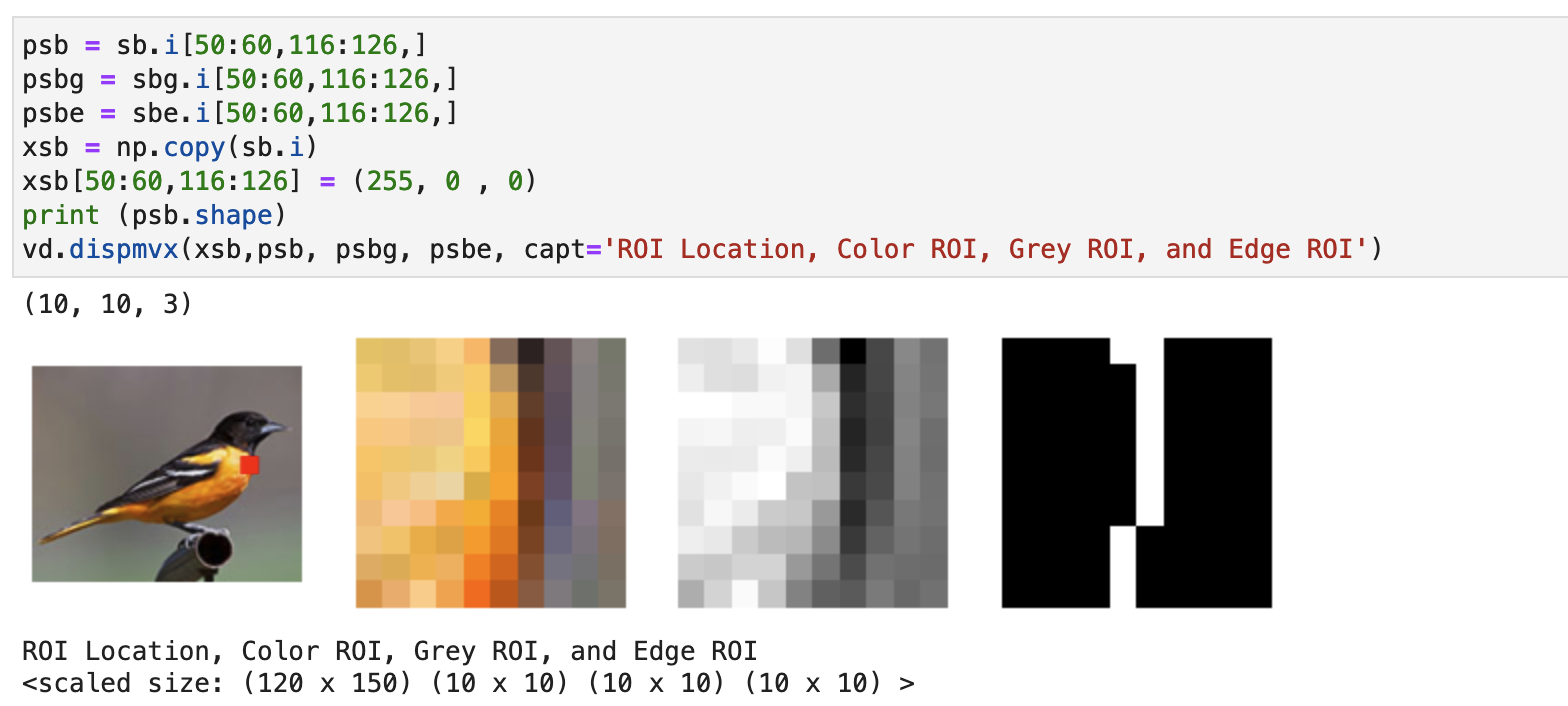
dispmvx uses the maplotlib package to create image presentations. This provides great flexibility in formatting a presentation than vd.dispvx; however, the image is always resized which may cause some distortion in the presentation. A comment that the image has been rescaled is always printed. In addition, dispmvx allows for user specified image resizing with the size= option. Multiple images may be specified as parameters; in which case, by default, they are all presented in a row. A single 3D image is also accepted as input, in which case, all (z) images are presented in a row or according to the grid= parameter.
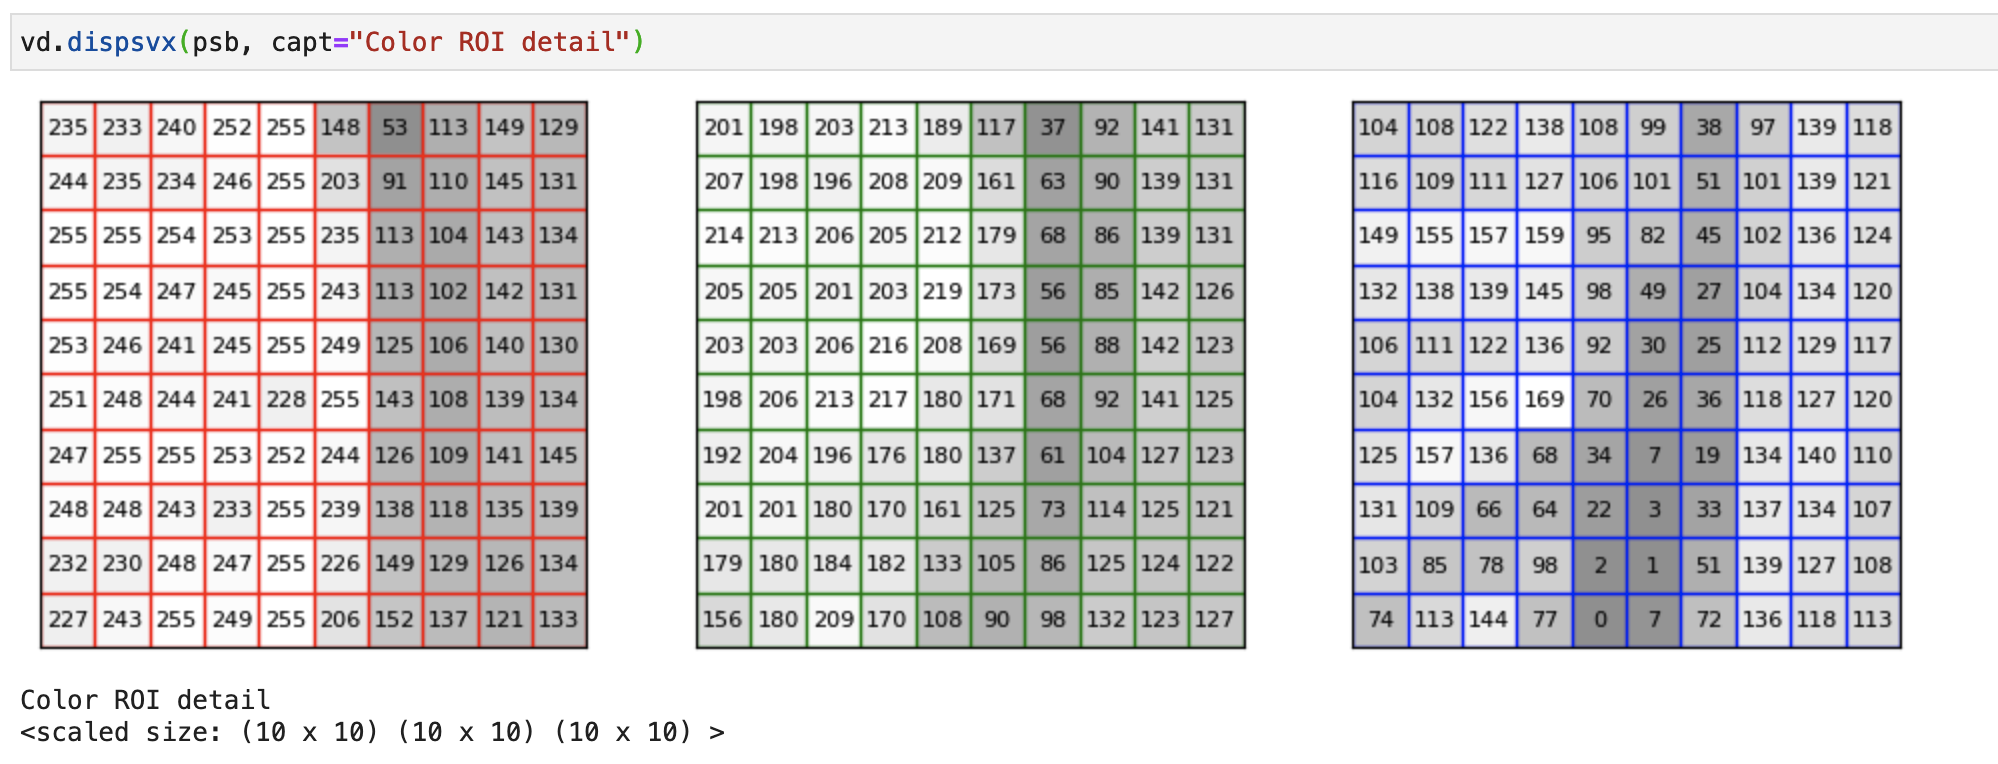
(dispsvx, now depreciated due to the dispmvx pvalues=True option) is simlar to dispmvx except that it is designed for small images. The pixel values are printed inside each pixel region. For color images, three grey level presentations are shown;, one for each color.
Maplotlib is a fully featured graphics package that provides a very large number of options. The advantage of dispmvx and dispsvx is that they conveniently use an appropriate set of options for good image presentation.
Parameters
| vximage |
This is the specifier for the image to be displayed. The image may be
specified by either
(a) a file name of a vx, png, or jpeg format file, (b) a vx.Vx image,
a numpy array or a PIL image.
|
|---|---|
| vximage2 |
This is the specification for a second image to be displayed.
Several images may be specified and they will all be presented in a row.
|
| grid= |
Specify a two-dimensional grid for arranging multiple images
(Default is a single row of all images). For example,
to specify a 4 x 3 grid set grid=(4, 3).
|
| pvalues= |
Set pvalues=True to specify that the numerical pixel values should be printed
inside each pixel. This is appropriate for small images that do not present well
as just grey level pixels.
This is only suitable for small images (x image dimension
less than 40). The intensity of the pixels are biased to make the black
printing visible. For color images three images are presented, one for each color.
This capability replaces the need for vdispsvx as a separate function.
|
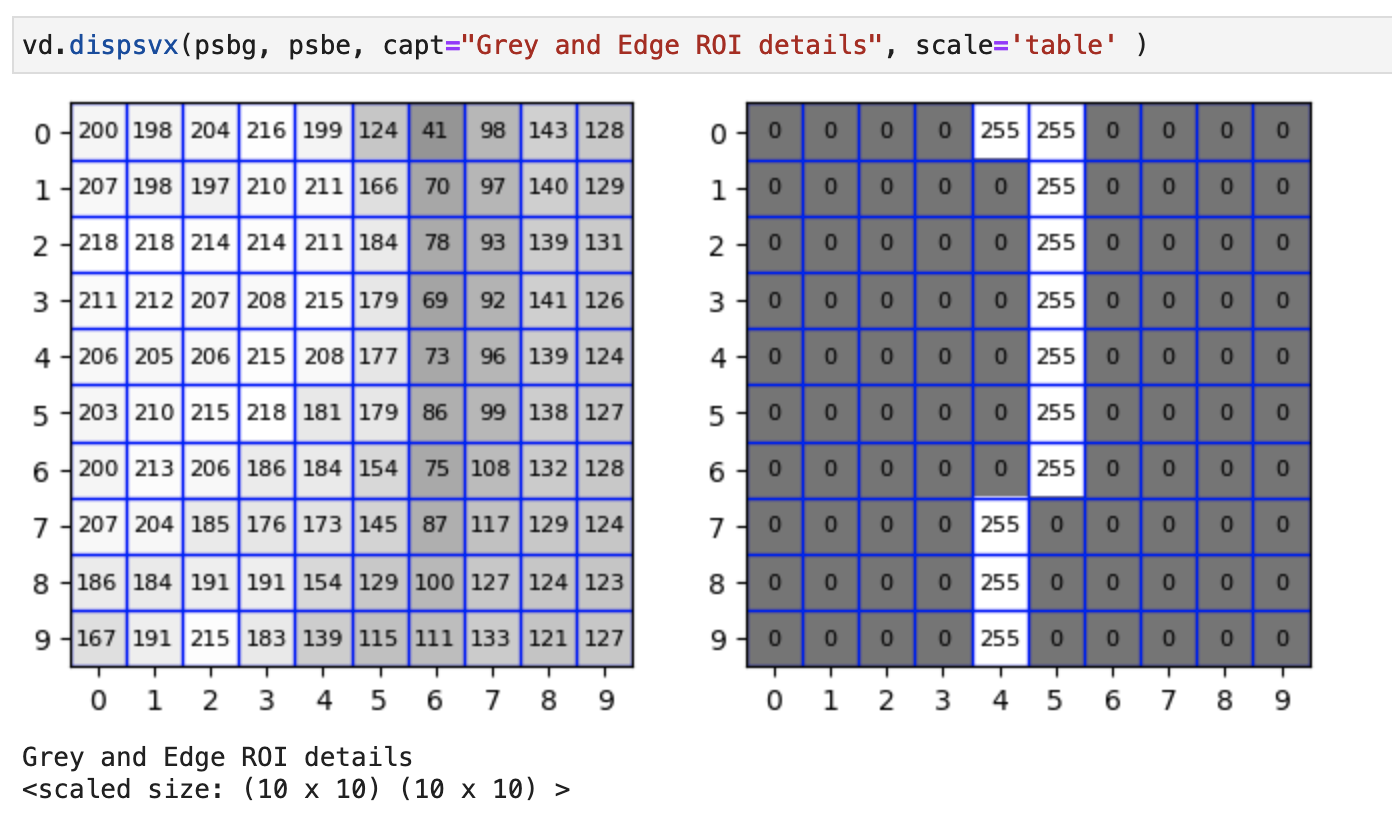
| scale= |
Default is "none". This option species that scales will be included
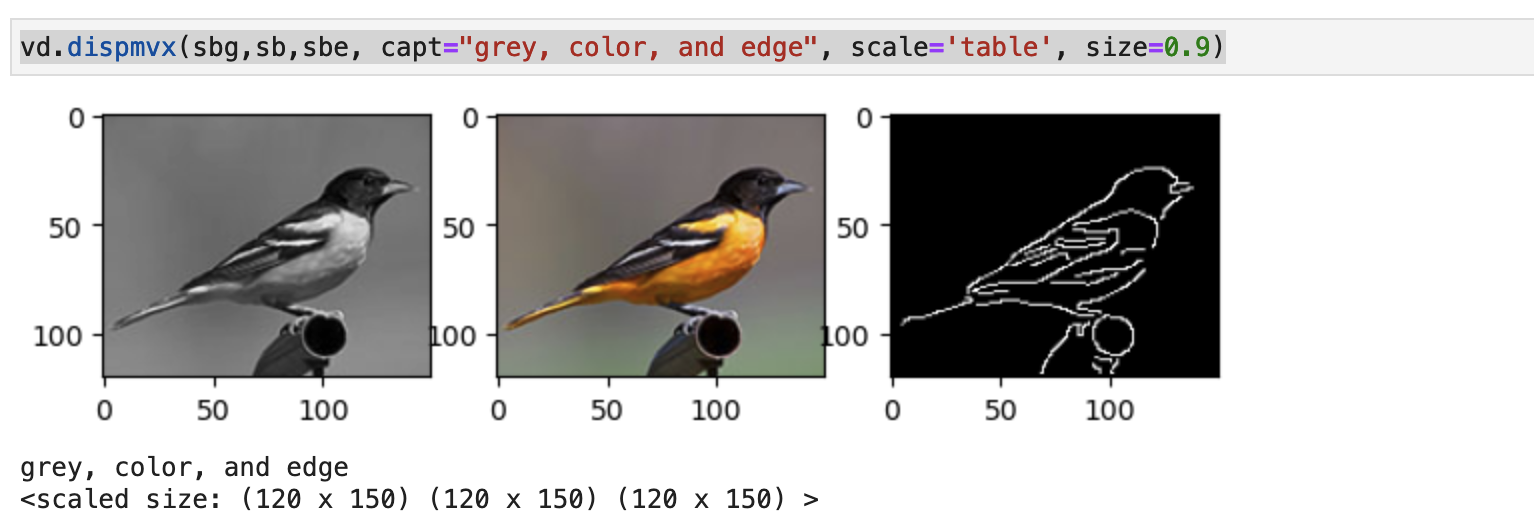
that indicate pixel locations. If 'table' is specified then
the python table (and numpy) indexing convention will be used
(y starts at the top of the image).
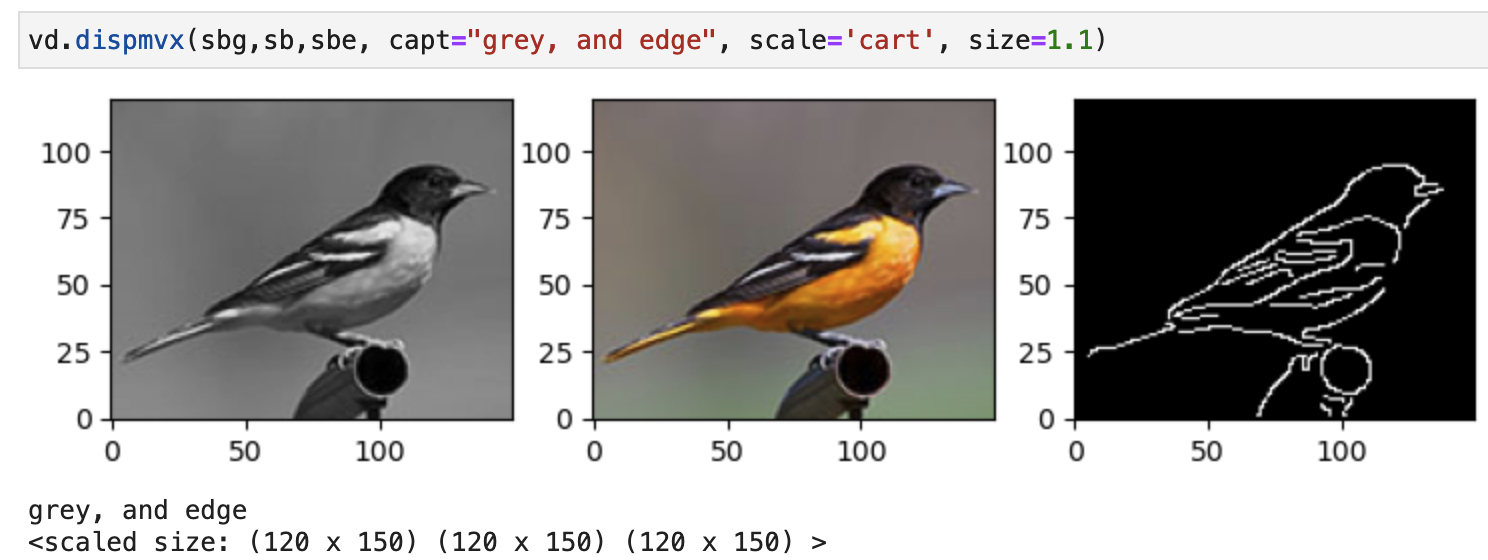
If 'card' is specified then standard Cartesian indexing will be presented in
which the y index starts at the bottom of the image. Cartesian indexing
is the traditional method used in graphics, maplotlib graphic presentations,
and is also used in visionx v4.
|
| size= |
Default is 1.0. This option species a multiplier to scale the size of
the presentation. For example, if the default presentation
appearance is too large then
a presentation with half that size could be achieved by
setting size=0.5.
|
| capt= |
str: the string specifies a caption that is printed immediately below the
image presentation.
|
| file= | str: specifies the file name in which to save the image presentation in png format. This replaces the on-screen presentation. |
Examples