vd.dhist
vd.dhist(vx-image, [bins=], [range=...], [histtype=...], [capt=...], [file=...])
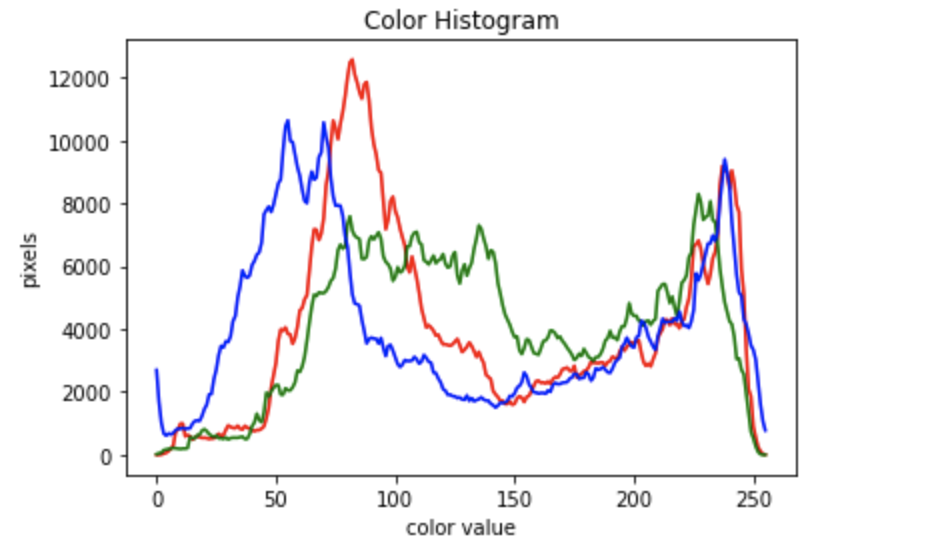
dhist computes a histogram of an image. For color images
three line plots are computed one for each color.
Parameters
| vx-image |
This is the specifier for the image for the histogram. The image may be
specified by either
(a) a file name of a vx, png, or jpeg format file, (b) a vx.Vx image,
a numpy array or a PIL image. The image may be either 2D or 3D.
|
|---|---|
|
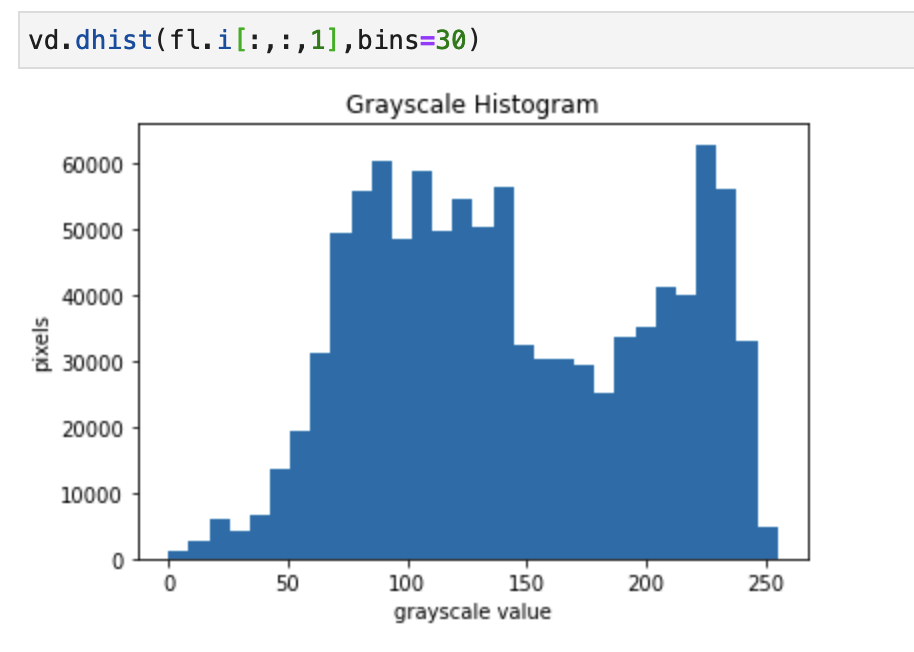
bins=
|
Default is 256. The number of histogram bins, only for grey images.
|
|
range=
|
Default is (0,255). The range, low and high, of the histogram values.
Pixels outside this range are not considered in the histogram.
|
|
histtype=
| This specifies the style of the plot according to the matplotlibi.pyplot.hist documentation. Allowed values are: {'bar', 'barstacked', 'step', 'stepfilled'}, default: 'bar' |
| capt= |
str: the string specifies a caption that is printed immediately below the
image presentation.
|
| file= | str: specifies the file name in which to save the image presentation in png format. This replaces the on-screen presentation. |
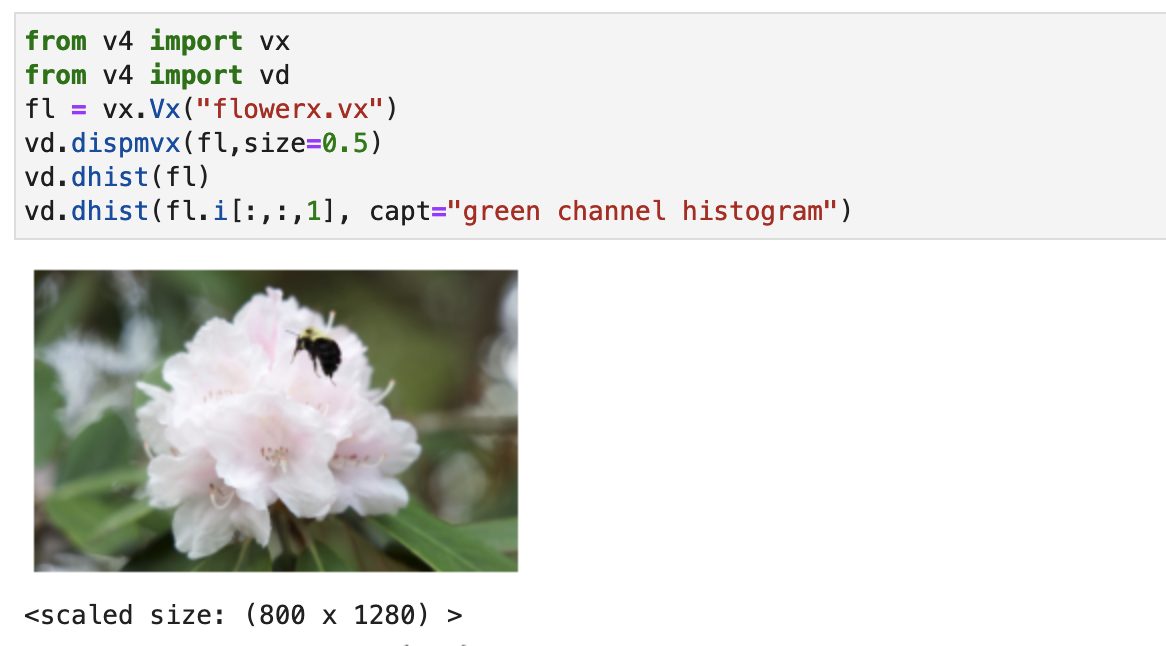
Examples