|
3D Optical-CT Single Cell Image Analysis
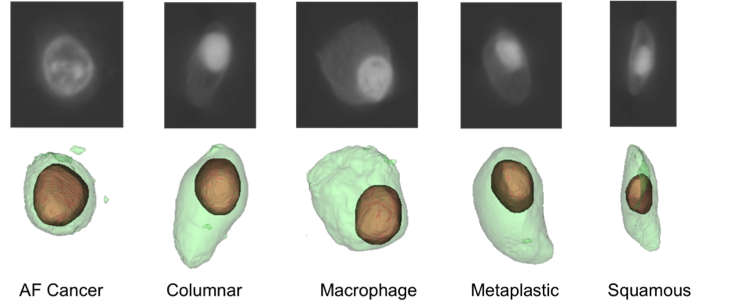
Three-dimensional single cell analysis is performed using optical CT microscope images. In the imaging process, a single cell is suspended in an optical gel and injected into a tube. Images from multiple perspectives are taken as the tube rotates and are reconstructed into a 3D image using the filtered back-projection method [1-3]. Compared to 2D cell images, 3D images provide more information and are not affected by cell orientations [1, 3]. Our database consists of 248 scans from 5 cell types: AF cancer cells, Columnar, Macrophage, Metaplastic and Squamous (see Fig.1). Cell nucleus and cytoplasm regions are segmented using two fully automated methods: a gradient-based method and a sequential graph-cut method. The sequential graph-cut method had a superior performance than the gradient method when compared to manual reference boundaries (Dice Similarity Coefficient 0.86 for nucleus and 0.72 for cytoplasm using graph-cut) [4].
Figure 1. Five types of cells. Upper row shows an axial CT slice and lower row shows the 3D visualization of segmented nucleus (brown) and cytoplasm (green).
|