

| |
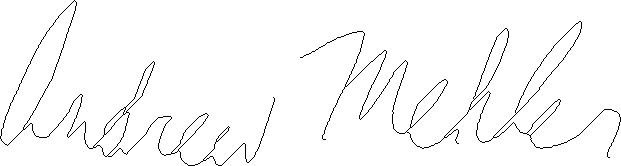
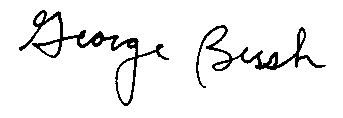
| Authentic Original | Authentic Preprocessed |
| |
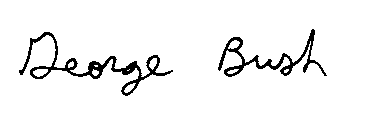
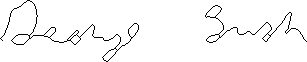
| Forged Original | Forged Preprocessed |
| |
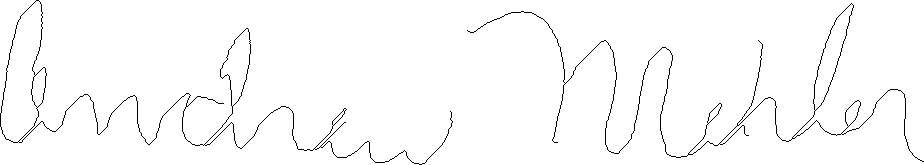
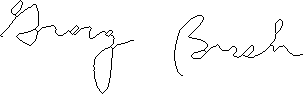
| Authentic Original w/o Pruning | |
| |
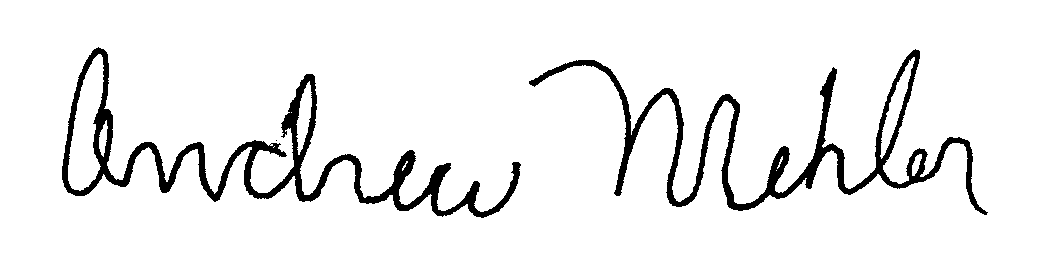
| Authentic Original | Authentic Preprocessed |
| |
| Forged Original | Forged Preprocessed |
 |  | |
| Height: | 161 | 165 |
| Width: | 621 | 924 |
| Area: | 2418 | 2782 |
| Center of Mass: | (307.320923, 61.564102) | (458.598846, 63.445721) |
| Edge Points: | 5 | 8 |
| Cross Points: | 53 | 28 |
| Closed Loops: | 25 | 11 |
| 1st Stroke | ||
| Top Point: | (74,165) | (38,164) |
| Bottom Point: | (5,21) | (6,25) |
| Length: | 159.677795 | 142.635895 |
| Slope: | 2.086957 | 4.343750 |
| Method | Correct Classifications(%) | False Positives(%) | False Negatives(%) | Total Misclassifications(%) |
|---|---|---|---|---|
| Adaboost (AB) | 92 | 5.2 | 2.7 | 8 |
| Quasi Newton | 84.4 | 7.7 | 7.9 | 15.6 |
| Nearest Neighbor | 82.1 | 6.5 | 11.4 | 17.9 |
| AB, grid features | 69.5 | 7.3 | 23.2 | 30.5 |
| AB, global only | 94.91 | 1.9 | 3.2 | 5.1 |
| AB, strokes only | 92.3 | 3.85 | 3.85 | 7.7 |
| AB, 1st stroke only | 51.16 | 0 | 48.84 | 48.84 |
| bb | Download | Man | Extracts bounding box |
| feature | Download | Man | Computes features |
| fv.pl | Download | Man | Automates creation of feature vectors |
| nn.pl | Download | Man | Computes nearest neighbor |
| random.pl | Download | Man | Randomly swaps lines between files |